
DATA STORIES | AGENTIC AI | KNIME ANALYTICS PLATFORM
Agentography with KNIME: Mapping AI Agent Traffic
How to use KNIME to pioneer “Agentography” — the analytics practice of understanding AI agent behavior on websites

Joe and Francois are industry veterans in their respective domains of expertise. Joe perpetually has one foot in MarTech, while Francois has dedicated his craft to digital analytics. They have always relished the chance to collaborate, as they believe vendors have artificially introduced barriers between what they consider to be MarTech, AdTech, and analytics.
This article chronicles how we used KNIME to pioneer a new field we’re calling “Agentography” — the analytics practice of understanding AI agent behavior on websites. As AI agents increasingly replace traditional visitors in the customer journey, we needed flexible, transparent tools that could help us explore this uncharted territory.
This age of discovery is reminiscent of the early awe-inspiring explorers that helped map Canada. Joe and Francois’ most admired pioneers were always the rugged “coureurs des bois” (literally “wood runners”). They hope to follow in their footsteps as they reveal AI agent behaviour and adapt with the same willingness to learn from the landscape itself.
Marketing analysts are proficient in bringing visitors to our sites, displaying products, and creating conversions. Now, visitors are conducting their initial research and discovery with AI services. By the time they reach the product page, visitors are already educated and ready to buy.
Much of this initial AI service activity is opaque. While the AI services will likely address this as part of their own platforms (ChatGPT has already announced the introduction of ads), we wanted to understand this new landscape with a vendor agnostic and ground-up examination. KNIME’s visual workflow approach proved to be the perfect vessel for this journey of discovery.
The journey inland begins now.
What are AI agents doing on my website?
This is the basic question that we asked each other. We were embarrassed to say that we didn’t know. We had basic unanswered questions: Will AI agents cache websites? When, if at all, will they interactively visit a website to get more information?
We didn’t know where we were, and we couldn’t imagine the cartography of agent behaviour. In some ways, we were like some of the earliest settlers of Canada, like Samuel de Champlain, who along with his contemporaries referred to the present day St-Laurent river as “The River of Canada”; unbeknownst to them, Canada stretched on for thousands of kilometers to the west, and contained thousands of rivers, and millions of lakes.
First, we needed to describe the types of agent traffic that we were most interested in measuring. We performed a mind mapping and research exercise, and came up with these categories:
- Agent browsing: automated
- Agent browsing: interactive (via human request)
- Agent referral (human follows link)
Out of these types of agent activities, we were most interested in the human-in-the-loop examples.
Why? Because any agent activity that is related to a human request can be connected back to consumer intent, and ultimately, revenue. Yes, “agent-to-agent” apps and protocols (e.g. MCP) are now emerging, but we wanted to focus on capturing and analyzing data that would be universally relevant for all brands.
We thought that the second type of browsing, #2 Agent Browsing: Interactive, could be one scenario that might be a blind spot for many brands. These are situations where AI agents are retrieving live updated information from websites, triggered by a current user request.
We decided to embark on our journey there.
Invisible Agents?
“Forbidding and desert lands” ~ Samuel de Champlain’s description of Ontario during a 1615 expedition
Our first attempt at this analysis turned out empty — as empty as a trappers pack after a long winter. We couldn’t find any agent activity on one of Francois’ gracious clients that was willing to make their public website available for our investigation.
Using Google Analytics, we weren’t able to identify any of the agent traffic that we defined (categories #1 through #3) for Francois’ client. This is despite our efforts to generate interactive agent traffic by asking various AI chatbots specific and detailed questions about the site. Yet, nothing — something appeared to be filtering out these activities.
Why? We thought it might be because agents use pseudo-browsers that ignore the digital analytics essentials: Javascript and tags.
For now, Google Analytics seemed designed to hide agent and crawler traffic, because Google doesn’t want you to care about that kind of traffic. Google Analytics is designed foremost to help you target these users by buying more ads, not map Agentography.
This is where we realized we needed a more exploratory, flexible approach — the kind of environment KNIME excels at providing.
Agent Visibility: No Pine Needles Required
During the harsh winter of 1535–1536, Jacques Cartier nearly died of scurvy because he and his crew did not know that they could make tea from pine needles and eat bark to prevent this vitamin C deficiency. Until the Iroquois gave them this knowledge, they were blind to this simple solution.
A simple solution awaited us as well.
We decided to go back to basics, and examine the lowest level information we could acquire: raw web server logs.
For this investigation, we used Joe’s website (spadinabus.com) and started to monitor the server logs, while we attempted to trigger an interactive agent browsing hit via AI chatbots.
We started to see early signs of activity that looked like this:
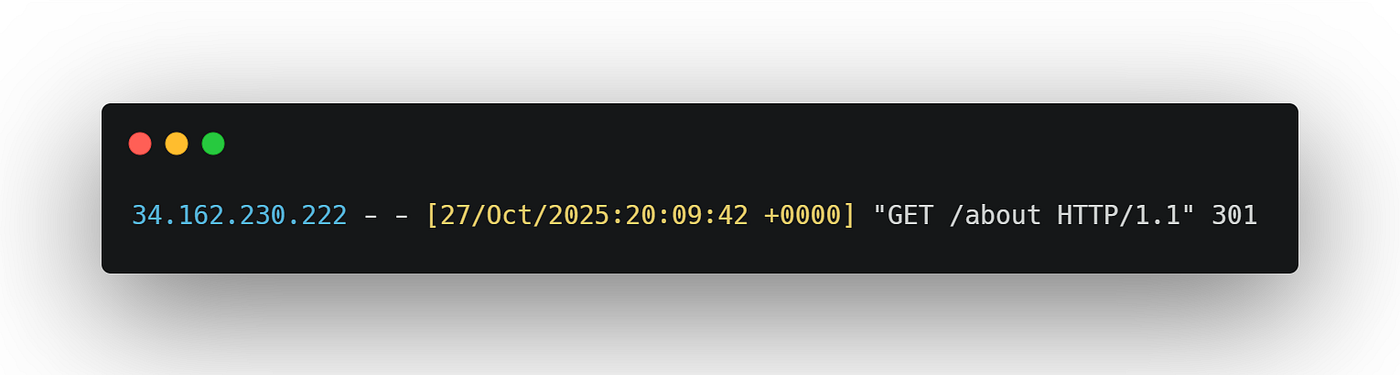
This was our first confirmed sighting of interactive agent browsing activities. We manually monitored the logs and confirmed IP addresses to capture this content, which would not lend itself to automation later on. We needed richer information from the logs.
To unlock more information, we modified Joe’s web server to include “User-Agent” string information, which is typically generated anytime someone (or something) asks for a web page. We hoped that various AI agent services would be kind enough to identify themselves. These strings typically contain information about who is visiting your website, such as the browser or operating system used.
Joe’s web server (Apache) has a configuration file that looks like the below, which allowed me to include user agent information to my logs:

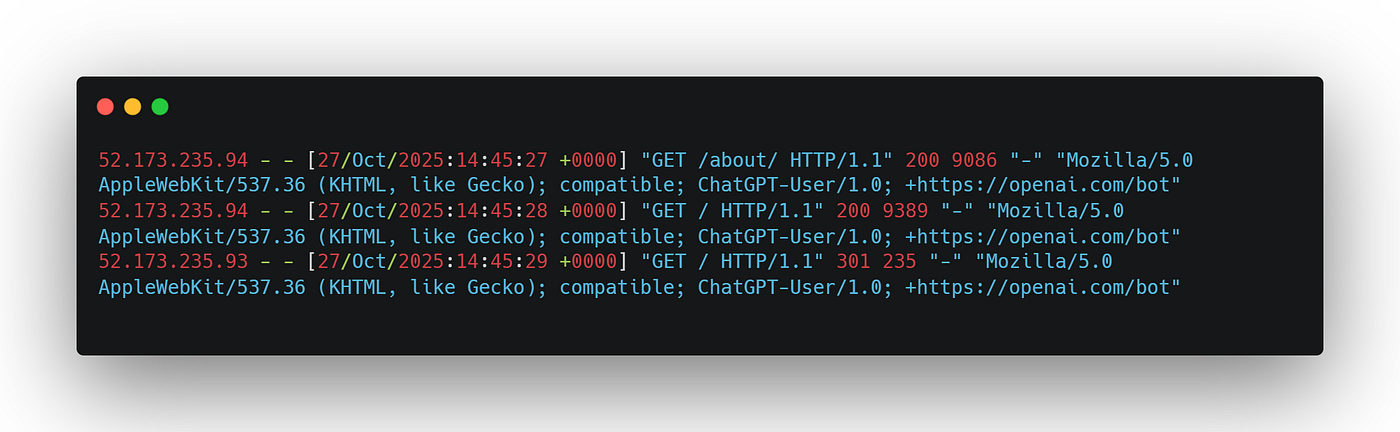
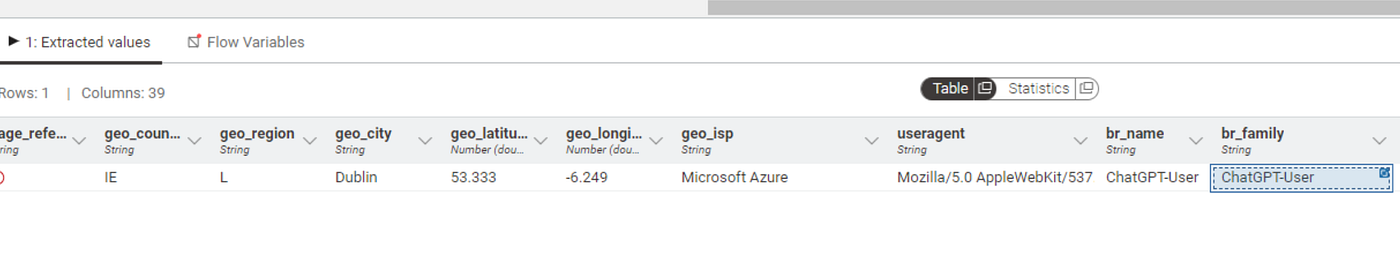
After this quick change, we were able to see interactive agent browsing traffic that was clearly labeled as originating from various AI chatbots. Below, we can see ChatGPT identifying itself now that the User-Agent string information is available:
This was a good first step, but we wanted to continue our mapping exercise. We wanted to understand the differences, if any, between AI agents, and how and when information about sites might be cached.
Now we had raw data, but it needed processing. This is precisely the kind of challenge KNIME was built for.
Cache: Fresh, or Frozen?
The term “cache” is borrowed from the French Canadian trappers’ slang while they were hunting for beaver pelts. It literally means a hiding place for supplies and provisions, kept secret from rival traders or other threats. For the rugged coureurs des bois, these stockpiles were essential lifelines for their return journeys.
In a contemporary context, cache refers to a high-speed storage layer that improves response times for digital user experiences. During our testing, we exposed that at least one AI agent, Google’s Gemini, was struggling to use a cache effectively.
Gemini’s behaviour deviated from the other three AI chatbots we tested: ChatGPT, Claude and Perplexity.
Gemini’s peers all interactively visited Joe’s website when we asked them about the About Us page. Yet, Gemini appeared to use a cached and outdated version of the page to generate its answer.
When we explicitly asked Gemini to revisit the page to revise its response, it claimed that it would dutifully and immediately do so. We observed Gemini displaying a temporary working message when supposedly performing an interactive query, before returning this message:

Gemini continued to display a response based on an older version of the page, while claiming that it had just interactively visited the site to confirm its answer. During this process, we continued to monitor my server logs, and I did not capture any new visits from Gemini.
Gemini’s cache appeared to be frozen, like a trapper’s glacier covered stockpile. We suspect that oddities like this are to be expected in these early days of AI exploration, especially as these services are frequently updated. Nevertheless, we successfully mapped a rudimentary way of capturing activity, and understanding how caching can affect our data.
These patterns would have been nearly impossible to detect without a visual, iterative analysis tool. KNIME’s workflow canvas allowed us to quickly experiment with different ways of processing and examining the log data until these behaviors became clear.
KNIME: The Birch Bark Canoe of Agentography
Champlain used traditional sailing ships to cross the Atlantic through the St. Lawrence to reach modern day Quebec City, the limits of deep-water navigation. From there, Champlain realized the only craft suitable for navigating the intricate network of rivers and shallow streams would be the birch bark canoes. These canoes were expertly constructed using techniques ingenious peoples had refined for thousands of years.
For mapping Agentography, KNIME became our birch bark canoe — agile, versatile, and perfectly suited for navigating unknown waters.
Traditional digital analytics tools like Google Analytics weren’t designed for this kind of exploratory work. Our first attempts to capture any agent activity through conventional web tags were not fruitful, despite repeated attempts. From a Google Analytics perspective, agent visits were invisible.
We were unsure if agents were triggering web tags or not, but we wanted to rule out other possible reasons they might have been filtered out. In one case, we built Triggers and Variables within Google’s Tag Manager (the most common way of getting data into Google Analytics).
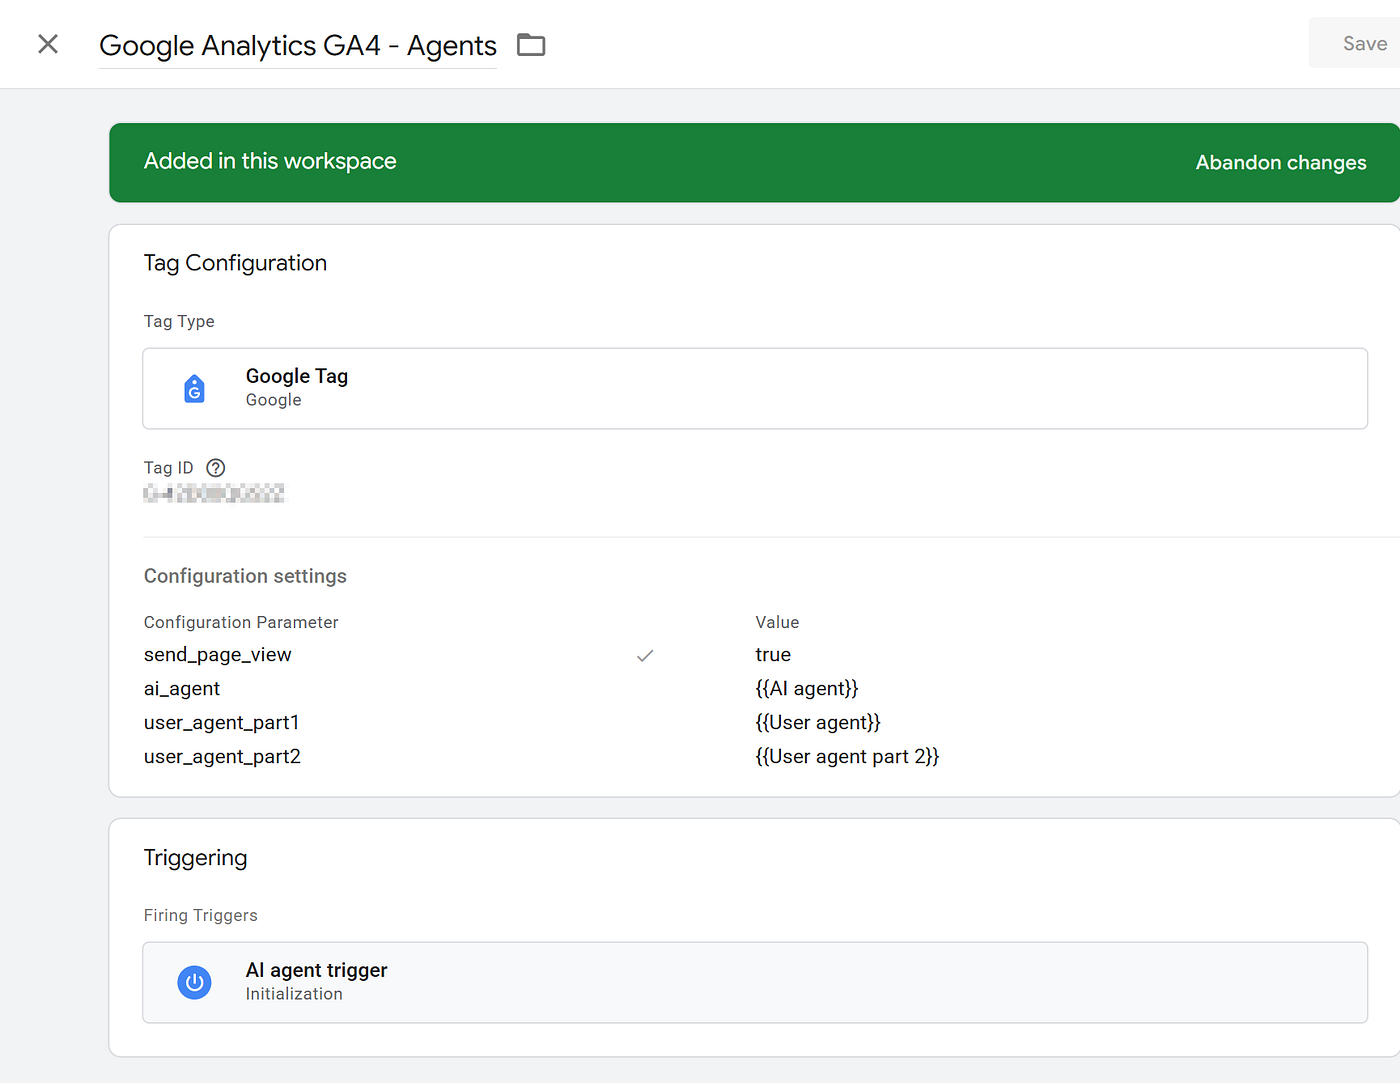
We thought it might be possible that Google was filtering out or ignoring agent traffic because they were not being offered consent for tracking (i.e. cookie acceptance). This configuration was designed to capture this traffic for our review.
The result? Zero hits.
For our tests, this meant that interactive agent browsing activity was exclusively traceable via server side methods like the logging method we discovered. Although websites make web tags and other client side (i.e. Javascript) information available to agents, we weren’t able to trigger their use in our testing.
We needed an agile and elegant way of navigating this new geography. Although we considered server-side event capturing agents from Google, Adobe and other vendors like Snowplow, we opted for KNIME because it gave us maximum flexibility to explore and discover at every step with a simple, universal and transparent design.
Building Our Agentography Workflow in KNIME
Crafting a birch bark canoe is a painstaking process that requires weeks of work, starting with harvesting and preparing a large birch bark sheet, thousands of feet of spruce roots and hundreds of cedar pines. Construction is an exacting task of stitching fragile bark onto a frame, then painfully forcing numerous cedar ribs into the hull to create a final (and hopefully) watertight shape.
Luckily, building our initial Agentography analytics workflow in KNIME was much easier than that.
KNIME’s visual low-code/no-code platform proved ideal for this investigation. We could quickly iterate on our approach, testing different data cleansing and analysis techniques without getting bogged down in code. The visual canvas made it easy to understand what we were doing at each step — critical when exploring genuinely new territory.
Below, we can see our initial KNIME workflow in action, where we built simple transformations using a point and click experience to make the logs easier to analyze.
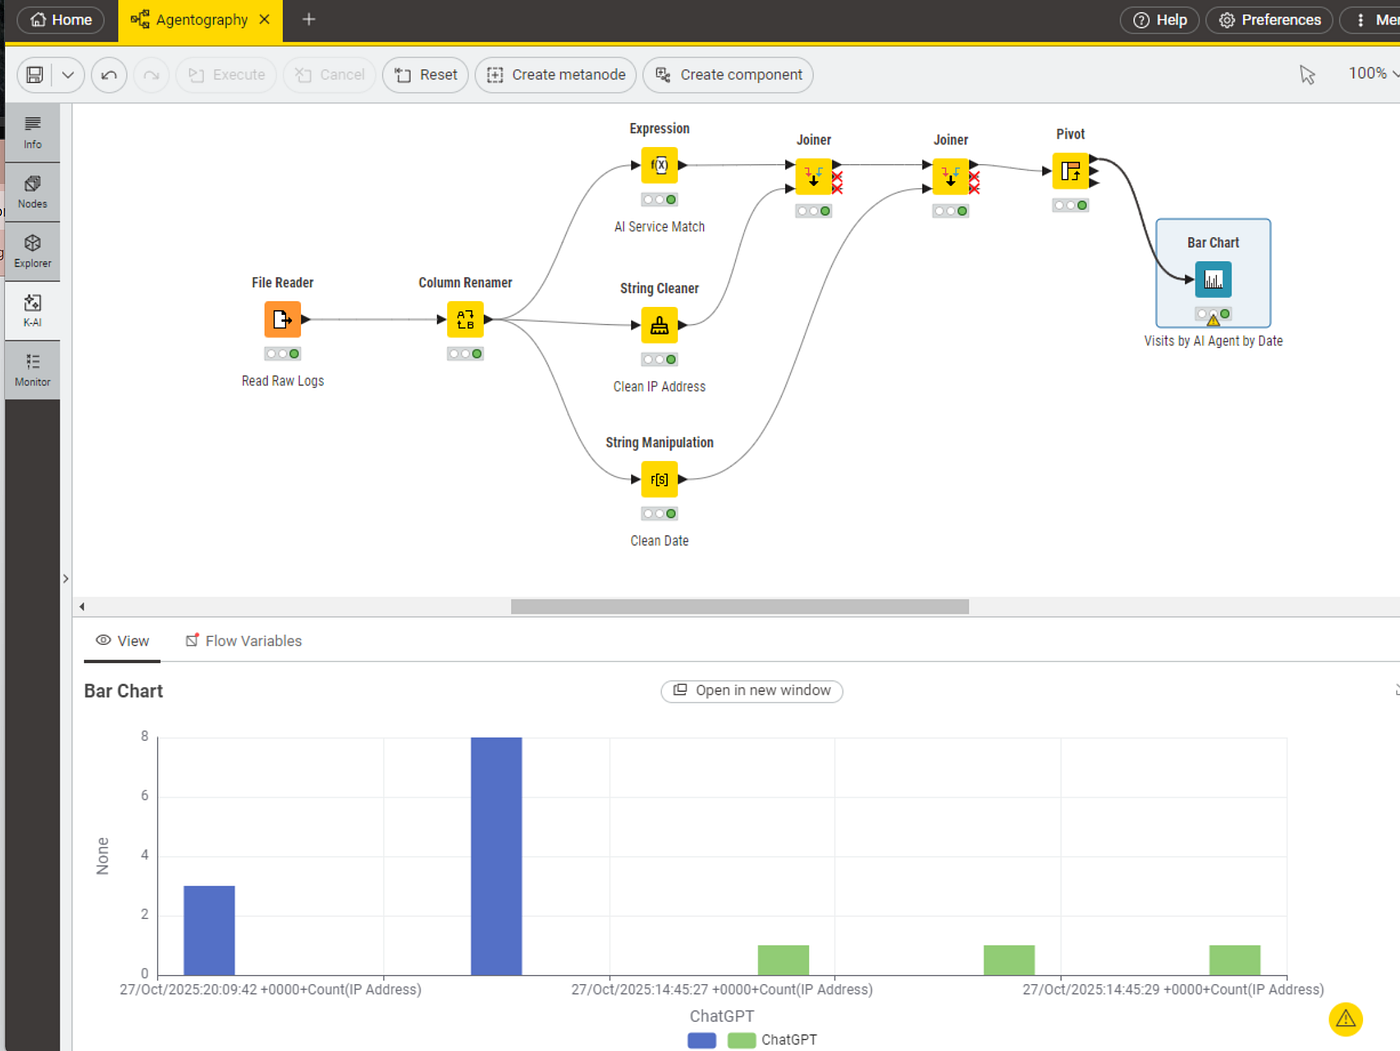
This first iteration of the workflow was used for gaining a bedrock understanding of the raw web logs before we introduced additional layers that might distort our findings. We used a series of data cleansing and transformation nodes in KNIME to prepare and visually explore the logs. We used the Expression node to tag key words associated with each agent service, while the String Cleaner and String Manipulation nodes cleaned IP addresses and dates. The Node Monitor (the lower pane of the workflow interface) allowed us to watch our logs transform during each step, while finally visualizing them with the Bar Chart node.
For our second iteration (see below), we started to lay the foundation for a more repeatable agent analysis pipeline:
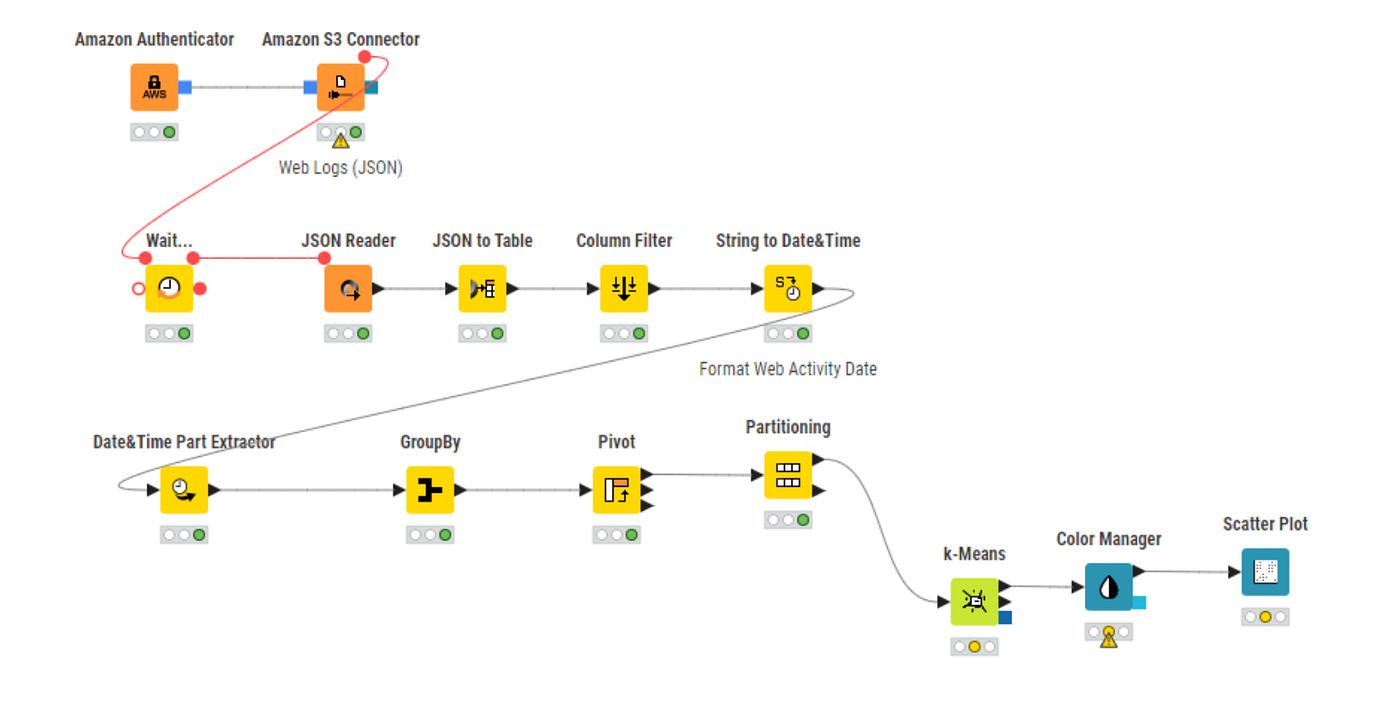
In this second workflow, we are now working with a version of the web logs that have already received some pre-validation and formatting through a web tracker (we used Snowplow). The JSON to Table node converts this developer-friendly semi-structured data, and makes it more approachable for business users with familiar columns and rows.
With traditional digital analytics, we would normally define what we consider to be a “user session” at this juncture. Customarily, sessions are defined by duration (e.g. 30 minutes) and changes in user identity. For agents, we have yet to define what the equivalent definitions are — it’s undiscovered territory. We aimed to further understand agent behaviour visually before attempting to define agent sessions.
To prepare for the next visualization, we used the GroupBy, Date&Time Part Extractor and Pivot nodes to count the number of agent visits by the day of the year. We thought it would be too granular to slice these visits into visits by each specific web page, so we grouped pages into broader categories.
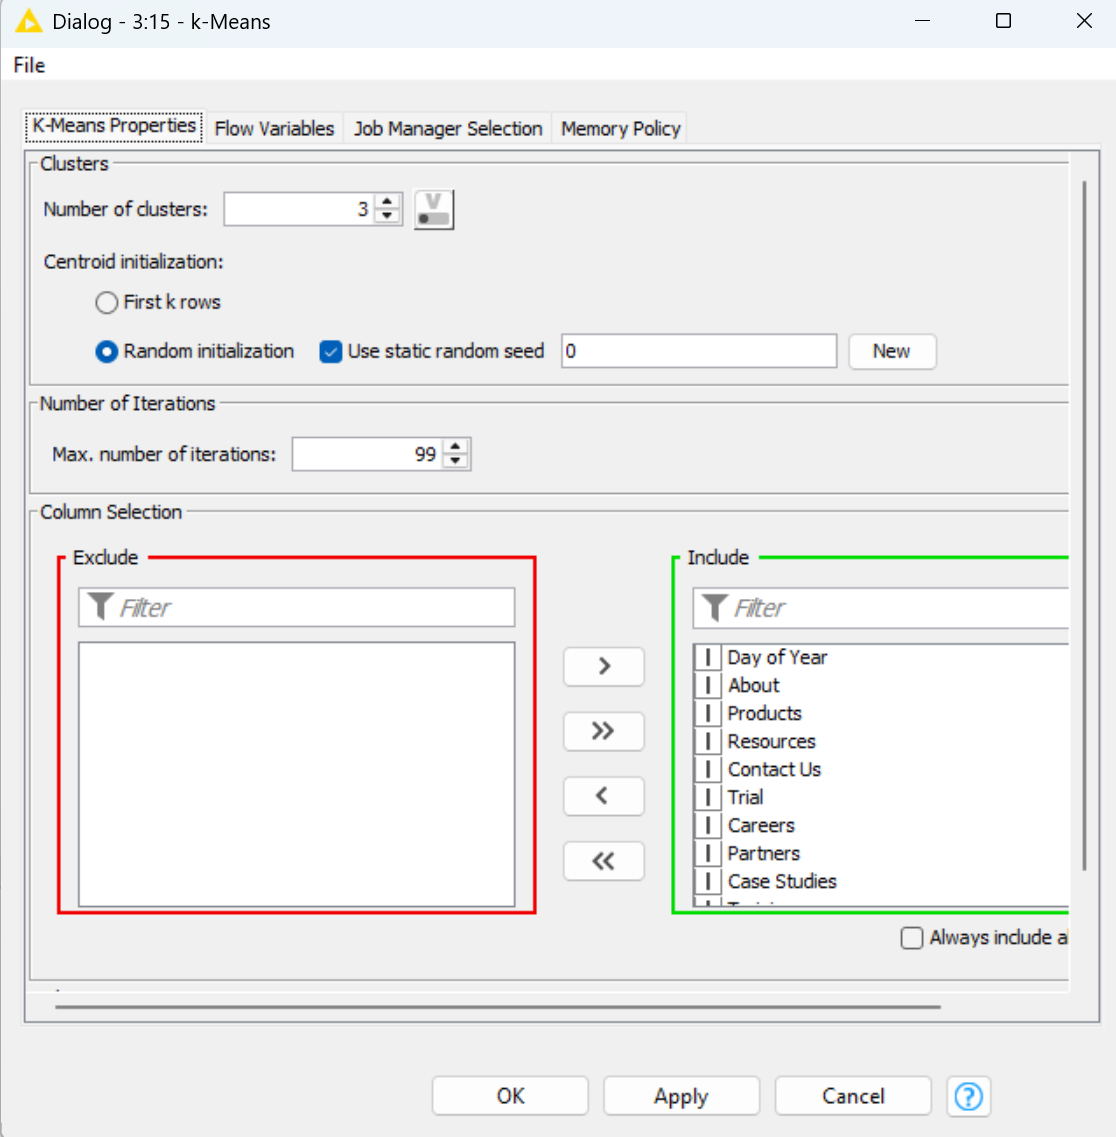
Above, we configured the k-Means node, which executes a clustering model useful for creating scatter plot visualizations. Here, we included our website categories, while setting the number of clusters to three. This configures the model to define three clusters that should correspond to the most significant types of visits by agents by day.

Finally, above we can see the output of the Scatter Plot node based on the inputted k-Means cluster model. Three clusters are defined for us, which roughly correspond to agent activities that are focused on three types of activities: learning about the company, learning about products, and learning about blogs and insights.
KNIME Makes Google Analytics Better
Our initial workflow helped us understand the basics of agent activities, while the second workflow helped further cleanse and prepare the data for visualizations and future insights. Rather than keeping these achievements within KNIME, we wanted to make them available to other tools. The natural first choice was Google Analytics, which is a staple for digital analytics experts.
Google Analytics offers a feature for ingesting server side and extraneous data, called Google Analytics Measurement Protocol. This is where Google Analytics users combine custom data with their traditional tagging metrics. Google offers a variety of methods to upload custom data, but we opted for KNIME’s Post Request node to use an API call.

In the above image, we can see traditional web tag information fed into GA Collection Endpoint using Javascript tags but there is also the possibility of loading data from an external source (“Your Server” in the image) like our curated AI interactive browsing data.
By combining the two tools, Google Analytics users have access to a new source of useful data for agent analytics. Google Analytics provides a familiar and powerful interface for behavioural analytics, while KNIME provides a flexible and agile way of curating the most actionable agent activity.
Why KNIME Was Essential for This Project
Several aspects of KNIME made it uniquely suited for pioneering Agentography:
Visual Exploration: When you’re genuinely exploring unknown territory, you need to see what you’re doing. KNIME’s visual canvas made it easy to understand our data transformations at each step and quickly spot and react to patterns we weren’t expecting. The visual canvas made it easier for the two of us to share and collaborate.
Rapid Iteration & Flexibility: As we discovered new aspects of agent behavior (like Gemini’s caching issues), we could quickly modify our workflow to capture and analyze these patterns. KNIME gave us the freedom to start simple and add complexity only where needed. We began with basic string matching and visualization, then added API integrations and more diverse data sources (i.e. raw logs to JSON) when we were ready — all within the same environment.
No Vendor Lock-in: Unlike proprietary analytics solutions, KNIME allowed us to work with raw server logs and integrate with any platform we chose. This vendor-agnostic approach was critical for understanding the true landscape of agent behavior.
Future Directions for Our KNIME Workflow
In future journeys, we hope to detect more complex insights related to:
- Comparison shopping
- Failed research or inquiries
- Missed promotions or bundling
- Shallow searches
- Missed product/service differentiators
- Linking to revenue
- Defining agent sessions
- Linking to referral traffic
Like a birch bark canoe over shallow waters, we hope our choice of KNIME’s flexible visual workflows will give us the maneuverability to adjust as Agentography reveals itself over time.
Join the Woodrunners
We have only paddled an initial foray into the interior with mapping Agentography, but we’re eager to learn more as we further hone our KNIME workflows and expertise. Unlocking server side activities, tuning digital analytics tools and adding KNIME’s visual data wrangling layer was only the start.
You can be a wood runner too. Reach out to Joe or Francois to share your own discoveries and Agentography questions.
We would love to hear from you about where we should go next — and how you might use KNIME to chart your own course through this new territory.